
Nằm trong danh sách chờ là một cảm giác không hề dễ chịu chút nào. Nhóm tư vấn APUS xin đưa ra một thống kê (tương đối) với 163 trường Đại học công và tư ở Mỹ trong mùa tuyển sinh 2016-2017 (năm ngoái) để các bạn tự tính toán khả năng được nhận từ các trường. Theo thống kê này: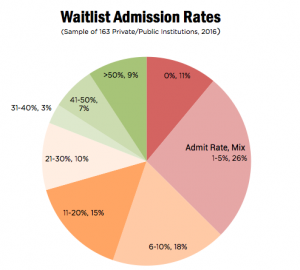
- Trung bình cứ 18 học sinh có 1 học sinh được nhận từ danh sách chờ
- 55% trường chỉ nhận 10% thí sinh từ danh sách chờ
- 37% các trường chỉ nhận 5% thí sinh từ danh sách chờ
- 11% các trường không nhận thí sinh nào từ danh sách chờ
Dưới đây là danh sách cụ thể các trường nhận/từ chối thí sinh từ danh sách chờ năm 2016- 2017:
| Waitlist Offered (2016) | Waitlist Accepted (2016) | Waitlist Admitted (2016) | Admit Rate (2016) | Notification Date | Link | |
|---|---|---|---|---|---|---|
| American | 3,116 | 501 | 0 | 0% | by 5/15 | Link |
| Amherst | 1,269 | 582 | 3 | 1% | Link | |
| Barnard | 1,615 | 1,340 | 59 | 4% | beginning 2nd week of May at earliest | Link |
| Bates | 1,063 | 334 | 49 | 15% | typically early May – late June, no later than August 1 | Link |
| Bennington | 262 | 255 | 182 | 71% | ||
| Boston College | 5,689 | 3,178 | 112 | 4% | closed 6/9 | Link |
| Boston University | 4,107 | 2,308 | 0 | 0% | ||
| Bowdoin | by 7/31 | Link | ||||
| Brandeis | 1,478 | 502 | 89 | 18% | ||
| Brown | 0 | by 6/30 | Link | |||
| Bucknell | 2,592 | 892 | 65 | 7% | ||
| Cal Poly SLO | 1,011 | 675 | by 5/15 | Link | ||
| Caltech | 636 | 468 | 8 | 2% | ||
| Carleton | 1,366 | 533 | 2 | 0% | ||
| Carnegie Mellon | 3,809 | 1,942 | 7 | 0% | by 6/1 (priority waitlist candidates first); no waitlist for Engineering, Architecture/Art/Design, | Link |
| Case Western | 9,293 | 4,732 | 333 | 7% | ||
| Claremont McKenna | 1,137 | 668 | 5 | 1% | ||
| Clemson | 1,794 | 659 | 3 | 0% | mid-May | Link |
| Colby | 1,864 | 650 | 61 | 9% | Link | |
| Colgate | 1,520 | 780 | 32 | 4% | by 8/1 | Link |
| Holy Cross | 1,074 | 459 | 14 | 3% | Link | |
| William & Mary | 4,115 | 2,037 | 154 | 8% | in progress, status mid-June, decision by 8/1 | Link |
| Colorado College | 784 | 213 | 21 | 10% | most by mid-May, some as late as June | Link |
| Colorado School of Mines | 1,427 | 111 | 9 | 8% | by 5/21 | Link |
| Connecticut College | 1,875 | 915 | 61 | 7% | Link | |
| Cornell | 4,571 | 2,874 | 61 | 2% | Link | |
| Dartmouth | 2,064 | 1,194 | 16 | 1% | mid-May to 7/1 (highly unlikely due to strong yield) | Link |
| Dickinson | 810 | 238 | 29 | 12% | Link | |
| Emory (Emory) | 4,187 | 2,150 | 61 | 3% | notifications through mid-summer | Link |
| Emory (Oxford) | 1,557 | 808 | 2 | 0% | notifications through mid-summer | Link |
| F&M | 2,600 | 16 | end of April to end of May | Link | ||
| George Washington | 4,493 | 1,616 | 170 | 11% | ||
| Georgetown | 2,134 | 1,334 | 80 | 6% | expect 40 accepted from waitlist, 75 of 100 offered spot on waitlist remain, final answer by 6/30 | |
| Georgia Tech | 3,830 | 2,267 | 470 | 21% | by 6/1 | Link |
| Grinnell | 1,032 | 395 | 97 | 25% | ||
| Hamilton | 1,071 | 475 | 47 | 10% | ||
| Harvard | highly unlikely due to strong 2021 yield | Link | ||||
| Harvey Mudd | 528 | 342 | 12 | 4% | ||
| Haverford | 1,079 | 412 | 26 | 6% | ||
| Johns Hopkins | 2,387 | 1,412 | 112 | 8% | Link | |
| Kenyon | 2,579 | 971 | 15 | 2% | update after 5/1 | Link |
| Lewis & Clark | 1,374 | 404 | 61 | 15% | late April to mid-May | Link |
| Macalester | 430 | 338 | 148 | 44% | ||
| Middlebury | 1,316 | 561 | 7 | 1% | early May to mid-June | Link |
| Miami – Oxford | 3,327 | 954 | 16 | 2% | by 8/1 | Link |
| MIT | 437 | 437 | 26 | 6% | closed 5/10; 14 admitted | Link |
| NYU | 925 students admitted from waitlist as of 5/22, including 70 spaces for Spring admission. No space in Abu Dhabi, Shanghai, SPS, Nursing or GLSP. Final decisions by 8/1 | Link | ||||
| NC State | 2,552 | 427 | 247 | 58% | by 6/15 | Link |
| Northwestern | 2,752 | 1,760 | 9 | 1% | by 6/30 | |
| Oberlin | 1,700 | 878 | 151 | 17% | ||
| Occidental | 821 | 416 | 70 | 17% | ||
| Pomona | 990 | 608 | 26 | 4% | Link | |
| Princeton | 1,237 | 840 | 18 | 2% | ~50 offered as of 5/12 | Link |
| RPI | 4,139 | 2,420 | 4 | 0% | ||
| Rice | 2,088 | 1,497 | 1 | 0% | by 7/1 | Link |
| Saint Michaels | 225 | 53 | 14 | 26% | typically mid-June | Link |
| Scripps | 675 | 290 | 83 | 29% | beginning late May | Link |
| Skidmore | 2,011 | 480 | 7 | 1% | ||
| Smith | 897 | 432 | 1 | 0% | ||
| SMU | 2,010 | 862 | 40 | 5% | Link | |
| Stanford | 1,569 | 1,044 | 55 | 5% | by 7/1 | Link |
| Trinity College | mid-April to 7/1 | Link | ||||
| Tufts | update in May/early June | Link | ||||
| Tulane | 3,881 | 1,168 | 0 | 0% | by 6/1 | Link |
| UC Berkeley | 3,760 | 2,445 | 1,340 | 55% | by 6/1 | Link |
| UC Davis | 9,381 | 3,112 | 2,571 | 83% | by 6/30 | Link |
| UC Irvine | 8,366 | 4,503 | 835 | 19% | by 6/30 | Link |
| UCLA | by 6/1 | Link | ||||
| UC Riverside | 4,642 | 2,753 | 0 | 0% | by 6/30 | Link |
| UCSD | by 6/30 | Link | ||||
| UCSB | 5,830 | 3,252 | 1,351 | 42% | by 6/30 | Link |
| UCSC | 9,983 | 5,707 | 4,097 | 72% | by early June | Link |
| UChicago | early summer | Link | ||||
| UIUC | 2,846 | 2,092 | 350 | 17% | by early June | Link |
| UMass Amherst | 6,085 | 1,787 | 515 | 29% | beginning mid-May | Link |
| Michigan | 11,197 | 3,970 | 36 | 1% | by late June | Link |
| UNC – Chapel Hill | 3,986 | 2,024 | 86 | 4% | by 6/30 | Link |
| Notre Dame | 1,796 | 743 | 85 | 11% | mid-May to late June | Link |
| Oregon | 998 | 444 | 388 | 87% | by 6/16 | Link |
| U Richmond | 3,209 | 1,236 | 60 | 5% | 5/1 – 6/30 | Link |
| U Rochester | 2,935 | 1,468 | 87 | 6% | ||
| USD | 1,756 | 626 | 362 | 58% | Link | |
| Virginia | 4,987 | 2,871 | 360 | 13% | closed | Link |
| Vanderbilt | 71 | Link | ||||
| Vassar | 879 | 409 | 21 | 5% | early May to 7/1 | Link |
| Virginia Tech | 3,588 | 2,405 | 1,697 | 71% | by 7/1 | Link |
| Wake Forest | beginning early May | Link | ||||
| Washington and Lee | 1,529 | 652 | 48 | 7% | beginning late April | Link |
| Wellesley | 1,641 | 957 | 23 | 2% | 3rd week in May to 6/30 | Link |
| Wesleyan | 2,262 | 1,134 | 55 | 5% | by 6/30 | Link |
| Wheaton – MA | 487 | 112 | 1 | 1% | by 7/1 | Link |
| Whitman | 922 | 371 | 3 | 1% | ||
| Williams | 2,343 | 864 | 24 | 3% |
Đăng ký nhận tin
Liên hệ
Tầng 16, Tòa nhà 54A Nguyễn Chí Thanh, phường Láng, Hà Nội
(+84) 98 2028 888
(+84) 98 5555 468
info@apusvietnam.com
© 2015 APUS Vietnam. All right reserved